
Auto Accidents in Los Angeles: Official Crash Statistics
This article is for informational purposes only and is not to be construed as legal advice. No attorney-client relationship exists based on the review of this article and none of the information in this article is legal advice.
Short answer: Official SWITRS crash data, as shown in UC Berkeley SafeTREC’s TIMS SWITRS Summary (crashes as of September 15, 2026), lists 315 traffic deaths in the City of Los Angeles in 2024 and 338 in 2025, and 773 in Los Angeles County in 2024 and 705 in 2025. The 2025 figures are provisional. Pedestrians were 162 of the city’s 2024 deaths. LADOT’s Vision Zero Safety Study found that killed and severely injured collisions in the city rose about 13% from 2017 to 2021.
Figures in this article were read from official sources on November 12, 2026. Each one lists its source, its years, and whether it is provisional.
Where the numbers come from
This page uses government crash data, a UC Berkeley tool that summarizes it, and LADOT reports, and no news reports:
- SWITRS. The Statewide Integrated Traffic Records System is California’s statewide crash records system. TIMS reports its SWITRS data as coming from the California Highway Patrol (CHP).
- TIMS. UC Berkeley SafeTREC’s Transportation Injury Mapping System uses SWITRS as its primary data source. Its SWITRS Summary says data is updated quarterly, shows “Crashes as of Sep 15, 2026 from CHP,” and notes that “2025 data is provisional and subject to change.”
- LADOT. The Los Angeles Department of Transportation runs the City’s Vision Zero program. Its January 2024 Safety Study used the City’s RoadSafeGIS crash data for 2017 through 2021, cleaned and compared with SWITRS and LAPD data.
City figures below cover the City of Los Angeles only (TIMS city view, unincorporated county areas not included). County figures cover all of Los Angeles County.
Traffic deaths in Los Angeles, 2021 to 2025
Source: TIMS SWITRS Summary, severity “Fatalities only,” crashes as of September 15, 2026. 2025 is provisional.
| Year | City of Los Angeles: people killed | City: pedestrians killed | Los Angeles County: people killed | County: pedestrians killed |
|---|---|---|---|---|
| 2021 | 338 | 143 | 840 | 305 |
| 2022 | 368 | 164 | 868 | 313 |
| 2023 | 343 | 156 | 814 | 287 |
| 2024 | 315 | 162 | 773 | 318 |
| 2025 (provisional) | 338 | 169 | 705 | 279 |
Based on these counts, pedestrians were between 42% and 51% of the people killed on City of Los Angeles roads in each year from 2021 through 2025.
People killed or seriously injured, 2021 to 2025
Source: TIMS SWITRS Summary, severity “Fatalities and serious injuries (FSI),” crashes as of September 15, 2026. 2025 is provisional.
| Year | City of Los Angeles: killed or seriously injured | Los Angeles County: killed or seriously injured |
|---|---|---|
| 2021 | 2,266 | 5,244 |
| 2022 | 2,200 | 5,135 |
| 2023 | 2,084 | 4,996 |
| 2024 | 2,193 | 5,213 |
| 2025 (provisional) | 2,431 | 5,165 |
These are counts of people, not crashes. Recent years can change as more reports reach SWITRS.
What LADOT’s Vision Zero data shows
From LADOT’s Vision Zero Safety Study (January 2024; City of Los Angeles, 2017 to 2021 data):
- Killed and severely injured (KSI) collisions rose about 13%, from 1,472 in 2017 to 1,658 in 2021.
- Pedestrians were involved in 38% of those KSI collisions, motorcyclists in 20%, and bicyclists in 9%. The remaining 33% were vehicle-only collisions.
- Unsafe speed was the primary collision factor in 40% of vehicle-only collisions that resulted in a fatality.
- The updated High Injury Network covers 549 miles of roadway, which is 7.5% of the citywide roadway network.
LADOT’s February 12, 2026 weekly update adds that around one in five fatal crashes in the City of Los Angeles were directly attributed to speeding in 2024.
LADOT’s study counts collisions, while the TIMS tables above count people. The two are not directly comparable.
Why the numbers can differ between sources
Crash counts can differ because sources cover different areas (city or county), count different things (crashes or people), use different cutoff dates, and revise recent years as reports come in. Before you rely on a figure, check its source, area, years, and as-of date. These are summary statistics. They do not describe any single crash and do not show who was at fault in any case.
What to do after an auto accident in Los Angeles
- Get medical care and call 911 if anyone is hurt.
- Exchange names, contact details, and insurance information with the other drivers.
- Take photos of the vehicles, the scene, and any traffic signals or signs.
- Get contact details for witnesses, and the report number if police respond.
- Keep medical records, bills, and repair estimates.
Our guide on what to do after a car accident covers these steps in more detail. To check what coverage drivers must carry, see minimum insurance requirements in California. Filing deadlines apply to injury claims, and claims against a public entity have a shorter deadline. Our statute of limitations guide explains them.
How LA Law Group can help
LA Law Group serves California personal injury clients from our main office at 21540 Prairie St Unit A, Chatsworth, CA 91311. Call (866) 625-2529 or visit our personal injury practice page.
No attorney fee unless we win your case. You are responsible for case costs regardless of the outcome.
Your initial consultation is free.
Sources
Read live on November 12, 2026 (America/Los_Angeles):
- UC Berkeley SafeTREC, Transportation Injury Mapping System, SWITRS Summary (SWITRS data from CHP, crashes as of September 15, 2026; 2025 data provisional). Severity settings “Fatalities only” and “Fatalities and serious injuries (FSI),” county and city views.
- UC Berkeley SafeTREC, TIMS Crash Summaries overview, which states that the tools use SWITRS as the primary data source.
- Los Angeles Department of Transportation, Vision Zero Safety Study, January 2024 (City of Los Angeles, 2017 to 2021 data).
- Los Angeles Department of Transportation, Weekly Update: February 12, 2026 and Safety Programs (Vision Zero).
Figures are summary statistics from the sources above. They are not rates, they do not describe any individual crash, and they do not show fault. Recent SWITRS years are provisional and may change. LA Law Group is not affiliated with CHP, UC Berkeley, or LADOT. Prior results do not guarantee a similar outcome. Attorney Advertising.
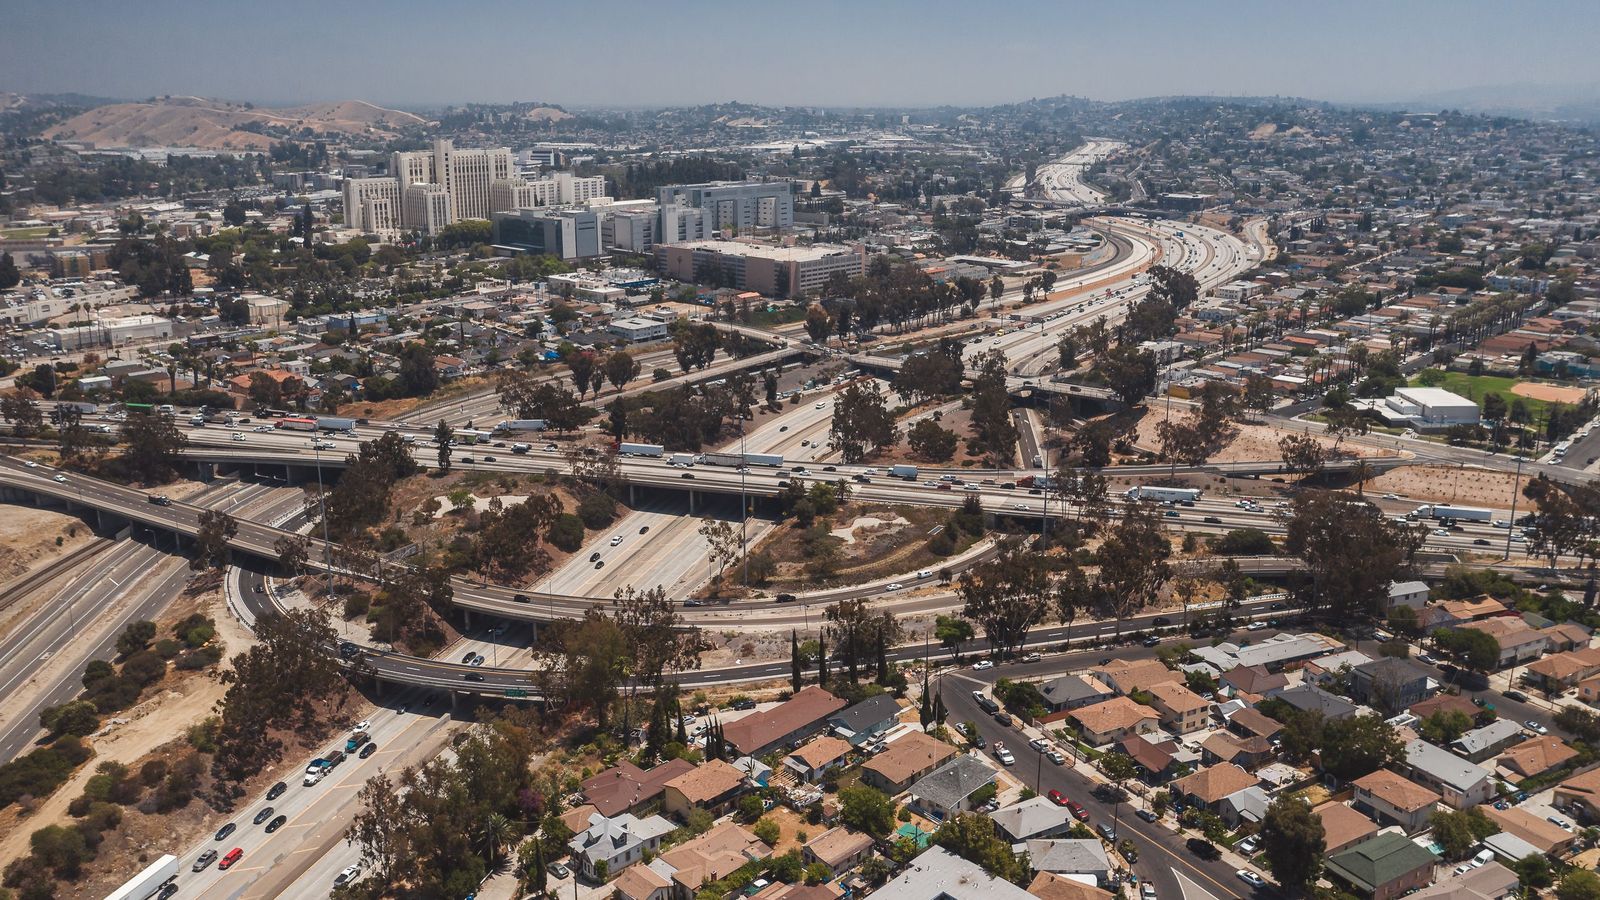
Photo: RDNE Stock project on Pexels (photo 8783598), under the Pexels License. Cropped to 16:9 and resized to 1600x900; no other edits. It is an illustration, not a photo of any crash.
Frequently asked
How many people die in auto accidents in Los Angeles each year?
In SWITRS crash data as shown in UC Berkeley SafeTREC's TIMS SWITRS Summary (crashes as of September 15, 2026, from CHP), traffic crashes in the City of Los Angeles killed 315 people in 2024 and 338 people in 2025. Across Los Angeles County, the counts were 773 in 2024 and 705 in 2025. TIMS says 2025 data is provisional and subject to change.
How many pedestrians are killed in Los Angeles traffic crashes?
The same TIMS SWITRS Summary data lists 162 pedestrian deaths in the City of Los Angeles in 2024 and 169 in 2025, and 318 in Los Angeles County in 2024 and 279 in 2025. The 2025 figures are provisional. In the city, pedestrians were between 42% and 51% of the people killed in each year from 2021 through 2025, based on those TIMS counts.
Where do Los Angeles crash statistics come from?
The Statewide Integrated Traffic Records System (SWITRS) is California's statewide crash records system, and TIMS reports its SWITRS data as coming from the California Highway Patrol (CHP). UC Berkeley SafeTREC's Transportation Injury Mapping System (TIMS) uses SWITRS as its primary data source and updates its summaries quarterly. LADOT uses crash data for its Vision Zero work; its January 2024 Safety Study used the City's RoadSafeGIS data, cleaned and compared with SWITRS and LAPD data.
Why do different sources report different numbers of traffic deaths?
Counts can differ because sources cover different areas (the City of Los Angeles or all of Los Angeles County), count different things (crashes or people), use different cutoff dates, and update recent years as reports come in. Recent SWITRS years are provisional. When comparing figures, check the source, the area, the years, and the as-of date.
What is the Los Angeles High Injury Network?
It is LADOT's map of the streets where serious and fatal crashes are concentrated. LADOT's Vision Zero Safety Study (January 2024) says the updated network covers 549 miles of roadway, which is 7.5% of the citywide roadway network.
How often is speeding a factor in fatal crashes in Los Angeles?
LADOT wrote in its February 12, 2026 weekly update that around one in five fatal crashes in the City of Los Angeles were directly attributed to speeding in 2024. LADOT's Vision Zero Safety Study found that unsafe speed was the primary collision factor in 40% of vehicle-only collisions that resulted in a fatality, based on 2017 to 2021 data.
What should I do after an auto accident in Los Angeles?
Get medical care and call 911 if anyone is hurt. Exchange information with the other drivers, photograph the scene, get witness contact details, and note the report number if police respond. Keep medical records and bills. Insurance and filing deadlines apply, so review them early.
Attorney Advertising. This article is general information, not legal advice, and does not create an attorney-client relationship. Prior results do not guarantee a similar outcome.